Google Ads Dashboard for Agencies: The Monthly Client Report in 20 Minutes
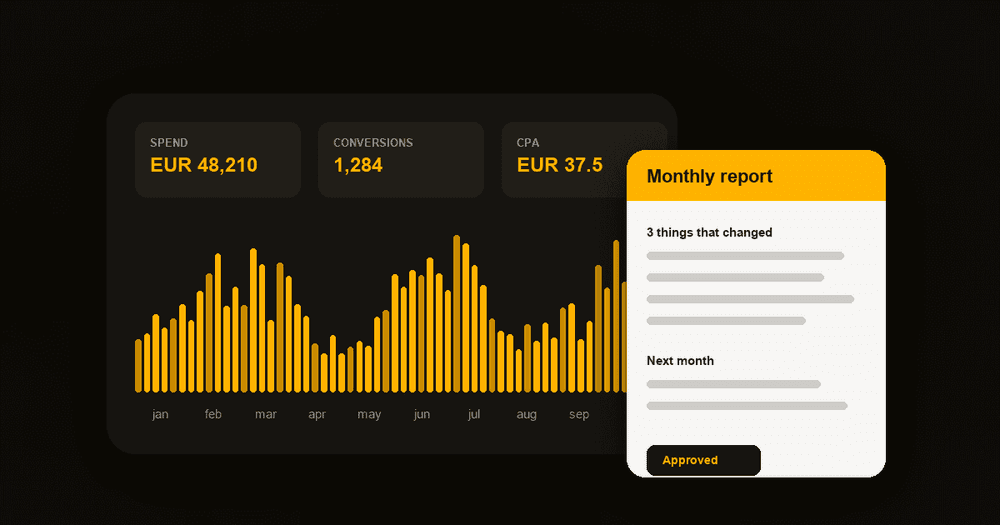
A dashboard says what the numbers are. A client asks whether it was worth it. A five-step method for the monthly Google Ads report, in about twenty minutes.
Every agency has a Google Ads dashboard. Almost none of them has solved client reporting.
The dashboard is live, accurate and always available. The client still emails at the end of the month asking what happened. That is not a tooling failure. A dashboard answers "what are the numbers", and the question a client is actually asking is "was this month worth the money, and what are you doing about next month".
This is a working method for producing that monthly report in about twenty minutes per account, and for deciding what the dashboard should do instead.
Why the dashboard is not the report
Three things a dashboard structurally cannot do.
It cannot say what changed and why. A chart shows that CPA moved. It does not know that you paused two ad groups on the 9th, that a competitor entered the auction, or that the client's landing page was down for a day. The explanation lives in your head and in the change history, not in the data layer.
It cannot prioritise. Everything on a dashboard has equal visual weight. The client reads 40 numbers and remembers none, or worse, fixates on the one that happens to be red. Your job in the report is to say which three numbers mattered this month.
It cannot commit to anything. A report ends with a decision: here is what we are doing in November and what we need from you. A dashboard has no next step.
So keep the dashboard. Just stop expecting it to be the deliverable. It is the place you pull numbers from, and the place a curious client can go between reports.
What the client actually reads
Assume the report gets four minutes of attention and the first screen gets most of it. In that first screen the client wants four answers:
1. Did we spend what we said we would spend? 2. What did that spend return? 3. What changed compared to last month, and why? 4. What happens next, and what do you need from me?
Everything else in the report is evidence for those four answers. If a section does not support one of them, it is there for you, not for the client.
The twenty-minute method
Five steps. The timings are a guide, not a stopwatch.
1. Pull the numbers — 3 minutes. Account totals for the month and the month before: spend, conversions, conversion value where you have it, CPA or ROAS, clicks, impression share. Then the same split by campaign. Do not pull anything you are not prepared to explain.
2. Find the three changes that matter — 5 minutes. Sort campaigns by change in spend and by change in conversions. The interesting rows are the ones where those two move in different directions: more spend and fewer conversions, or less spend and the same conversions. That is usually your whole story. Three items is the limit. A report with nine findings has none.
3. Explain each one — 5 minutes. For each of the three, write one sentence of cause. Your change history is the first place to look, then auction insights, then anything that happened outside the account: seasonality, stock, pricing, a promotion, the client's own site. If you genuinely do not know the cause, say so and say how you will find out. That reads as competence. A confident wrong explanation does not survive the third month.
4. Decide next month — 4 minutes. Two or three concrete actions with an owner and a date. "Continue optimising" is not an action. "Split the branded campaign out of the generic one by 8 November" is.
5. Write it — 3 minutes. Into a fixed structure you never change, so the client learns where to look.
The structure that stays the same every month
Six blocks, in this order:
- Headline. Two sentences. Spend, the main result metric, direction versus last month.
- The three things that changed. One line each, with the cause.
- Numbers table. This month, last month, change. Six to eight rows, not thirty.
- What we did. The work, not the activity log. Group it: structure, creative, bidding, tracking.
- Next month. Two or three actions, each with a date.
- What we need from you. Budget approval, creative, a fix on the site. Often empty, and that is fine.
The value of a fixed structure is compounding. By the third month the client reads it in two minutes because they know the shape. By the sixth they notice when a section is thin, which is a useful pressure on you.
Which numbers to include, and which to drop
Include spend, conversions, cost per conversion, conversion value and ROAS if ecommerce, and impression share lost to budget if you are going to ask for more money.
Drop average position, which no longer exists. Drop raw impressions as a headline metric, since it rewards the wrong behaviour. Drop CTR at account level, because it averages across campaign types that have nothing to do with each other. Drop quality score as a reported metric, because it moves for reasons you cannot explain in one line.
The test for a metric is simple: if it moved 30% and you could not explain why in one sentence, it does not belong in a client report.
Dashboard or report
| Dashboard | Monthly report | |
|---|---|---|
| Question it answers | what are the numbers | was this worth it, what next |
| Audience | you, and a curious client | the person who signs off the budget |
| Updated | continuously | once a month |
| Contains causes | no | yes, that is the point |
| Ends with a decision | no | always |
| Right length | as much as fits | one page |
Both are worth having. The mistake is building the second one out of screenshots of the first.
Doing the pull with an AI assistant
Steps 1 and 2 are the mechanical ones, and they are where the twenty minutes usually turns into ninety. They are also the part an assistant with direct account access can do properly, because it can query the account rather than read a screenshot of it.
HYPD maintains a free, open-source Google Ads MCP server that connects Google Ads to Claude, ChatGPT or any MCP client. With it connected, step 1 is one request:
Pull October and September for this account: spend, conversions, conversion value, CPA, ROAS and impression share lost to budget, at account level and by campaign. Put them side by side with the change.
And step 2 is the follow-up:
Which campaigns moved spend and conversions in opposite directions? List them with the size of each move, largest first.
Two points of honesty about this. The assistant finds the rows; it does not know why they moved, and you should not let it guess. And read what it returns against the interface before it reaches a client, because a reporting error in month one costs more than the time it saved. The agency audit checklist covers the same workflow for a deeper quarterly review, and 15 Claude prompts Google Ads agencies actually use has the prompt patterns.
If you also run Meta or ChatGPT Ads for the same client, Meta Ads MCP and OpenAI Ads MCP put those in the same conversation, which is what makes a cross-channel report possible in one sitting rather than three. Pricing has the plan details, and connecting Claude to Google Ads safely covers the access model before you point anything at a client account.
Four mistakes
Sending the dashboard link instead of a report. It moves the work of interpretation onto the client. They will either not do it, or do it badly and arrive at a conclusion you then have to argue with.
Changing the format every month. Each redesign resets the client's reading speed to zero and looks like you are hiding a bad month behind a new layout.
Reporting activity instead of work. "47 negative keywords added" is activity. "Cut spend on non-buying search terms, which moved CPA from 62 to 51" is work. The first is a defence against the question of what you do all day. The second answers it.
Leaving out the bad month. Clients forgive a bad month explained in the report. They do not forgive finding it themselves in the dashboard three weeks later.